One major challenge I have encountered in this foray into cross-platform development has been getting consistent debugging and analysis information. Doing this on one platform can be tough enough, but when doing it across different platforms, there aren’t many consistent tools or standards.
Summarizing my needs:
1) I need consistent, fast text output for debugging.
2) I need clear messages from my program which indicate what went wrong.
3) I would like some kind of performance profiling tool, to measure what parts are too slow, so I can optimize them.
4) I would like to have some idea about what my RAM usage is, to help spot memory leaks.
First, I need to come up with a standard way of keeping track of memory and the call stack. The call stack is the tricky part. As long as I have to do some re-arranging of the engine to fit the SDL way of doing things, I might as well go try adding some low-level experimental stuff to the “core” of the engine while I’m there. Every time there is any memory allocated, it will be allocated via the core, so I can keep track of it. Similarly, every time a call is made, it will also call the core to notify what call was made. I am worried about the performance overhead of calling the core that often so I’ll make it optional via a compile-time macro. While I’m at it, with the stack trace I can additionally measure the amount of time spent during each call. These ideas should hopefully take care of needs 2, 3, and 4.
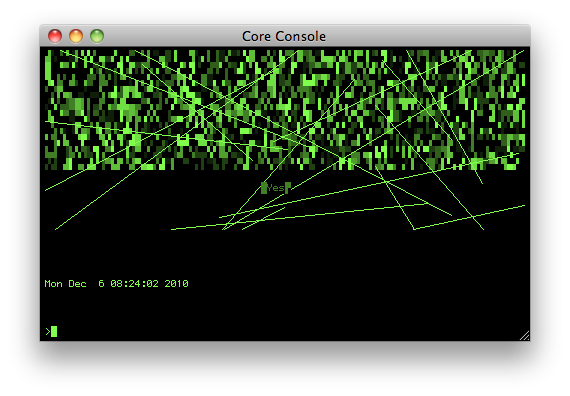
Finally, for need #1, I would like a way to display the information gathered, right in the app, in real-time. There aren’t really any existing solutions for this — at least not simple/light-weight ones. You’d think that it would be fairly common to render text and stuff like this, but unfortunately you have to do that yourself. It just so happens that I’ve already developed something similar for this. I plan on tightly integrating it with the “core” I talked about above, and I’ll call it the Core Console. Here’s what it looks like with a raster graphics and semigraphics test (all the lines and dots and stuff are the graphics test, and the command line is at the bottom, with the date being text output just above it):
That’s all rendered in software, to a single texture. It’s really fast and light-weight, and I expect it will work perfectly for debugging and analysis right in the game, without the need for external tools.
– Jake

